
VISUAL is tested iteratively each year through empirical case studies with our industry partners, as a basis for assessing and developing the language. The energy supplier Hafslund Strøm was the host of the first industry case in VISUAL.

Thor Haugnæss
“In recent years we have adopted several new communication channels to support the dialogue with our customers,” says Thor Haugnæss, business developer at Hafslund. “It is challenging to provide a consistent customer experience across all the channels, especially since there are several actors within the Hafslund group who are involved and directly touches upon the customer relationship.”
The purpose of the case study was to investigate the customer journeys associated with on-boarding of new customers – both as expected by the service provider and as experienced by the customer. The scope of the journey ranged from customer order placement (via call centre, web, or telemarketing) to payment of the first bill and was divided into three phases: 1. order placement and confirmation, 2. introductory sales and start-up, and 3. meter reading and payment.
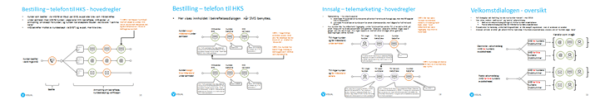
Mapping the expected customer journey
The analysis of the customer journey in terms of expected service delivery was carried out through structured brainstorming sessions with the representatives from the operational groups involved, and through information exchange with frontline staff, product owners, system architects, and others involved in various stages of service provisioning. Due to the multi-channel nature of the service delivery systems and choices made by the customer, quite a few different expected journeys were identified. The journeys were to a large extent characterised by automated touchpoints from the company’s IT-systems, but they also involved touchpoints with human intervention.
Analysis of actual customer journeys
A total of 10 customers were recruited for the purpose of detailed mapping of customer journeys. The process of becoming a customer can take several weeks, and we chose to approach the actual journeys through interviews in combination with customer diaries. Customers were recruited through telephone interviews shortly after their first encounter with Hafslund, and they were asked to document their experiences in a diary until receiving the first invoice. Follow-up interviews were conducted with the purpose of reviewing the touchpoints and associated experience. This final interview was carried out as a structured walk-through of all the interactions with the service provider and the associated experiences. Tracking the service process from the back-end systems served as a supplementary source of information, especially in identifying target customers, tracking touchpoints, and monitoring their progress. The customers’ actual journeys were reconstructed by triangulating data from the interviews, the diary, and internal process information from back-end systems.
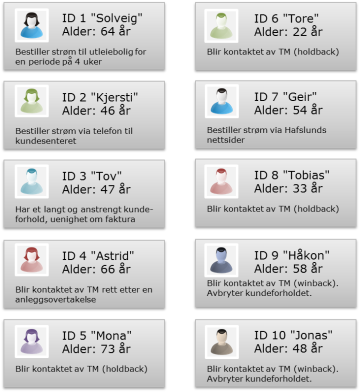
Ten customers were recruited for analysis of customer experience
A total of 10 customers were recruited for the purpose of detailed mapping of customer journeys. The process of becoming a customer can take several weeks, and we chose to approach the actual journeys through interviews in combination with customer diaries. Customers were recruited through telephone interviews shortly after their first encounter with Hafslund, and they were asked to document their experiences in a diary until receiving the first invoice. Follow-up interviews were conducted with the purpose of reviewing the touchpoints and associated experience. This final interview was carried out as a structured walk-through of all the interactions with the service provider and the associated experiences. Tracking the service process from the back-end systems served as a supplementary source of information, especially in identifying target customers, tracking touchpoints, and monitoring their progress. The customers’ actual journeys were reconstructed by triangulating data from the interviews, the diary, and internal process information from back-end systems.
The figure below shows the last part of a customer’s journey and concerns notification of meter reading and payment. In this diagram (“deviation view”), a horizontal line separates the expected touchpoints (above the line) from ad-hoc touchpoints (below the line). Only the communicative events are shown in the figure, although rich material about the associated customer experience was also collected through the interviews.
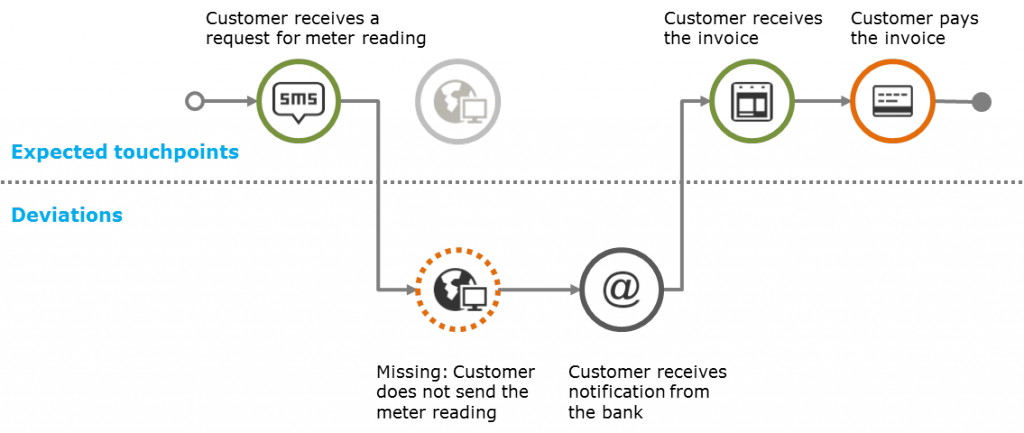
Part of a customer’s actual journey
In this example, an SMS from Hafslund notifies the customer of a meter reading. In this case, the customer fails to report the meter reading to Hafslund. It is not unusual that actual journeys are missing some touchpoints. The figure also shows the presence of external actors in the journey, such as the bank.
A customer journey analysis often reveals subtleties in the customer experience that are not readily available to a service provider. The deviation view provides an immediate way to identify gaps in their service offerings by comparing actual journeys with the expected journeys. However, it is important to bear in mind that deviations from the expected journey do not necessarily imply a bad customer experience. Furthermore, a mapping that includes external actors can be useful in providing an overview of all the touchpoints that form the customer’s service experience. Customers seldom distinguish between the different actors in a journey; thus, actors that initially are not a part of a service are experienced as if they were.
Feedback and lessons learnt
Results from the case study was presented in a workshop with Hafslund employees. A questionnaire at the end of the workshop collected feedback concerning the visual language and helped to assess the usefulness of the study.
In general, Hafslund employees reported that the visual representation of customer journeys was clear and easy to understand, offering a comprehensive and valuable overview of what the customer went through. However, some suggestions were made as to how to improve symbols and the visualisation of different actors.
“Based on the input from Hafslund we decided to change the labelling of the touchpoints and started to look into ways to distinguish the status of touchpoints”, says Ragnhild Halvorsrud, responsible for the Hafslund case study. “Furthermore we added support for visualising deviations in the sequence of touchpoints. We also got valuable input regarding changes to some of the symbols used, to make them more intuitive”.
In Hafslund, the case study results have been used for customer-orientation purposes by disseminating the customers’ experiences with the on-boarding journey among Hafslund employee.
“This is an efficient way to obtain a common understanding of the customer journey, and to see the hand-over between the different departments involved”, says Thor Haugnæss.
“For the next case study we would like to test VISUAL when designing new customer journeys”, Thor concludes.


